
Recently, I migrated my containers from a standalone Docker node to Docker Swarm. On the standalone node I used a local VHD for persistent storage, but now I’m using NFS Docker volumes defined in the compose file. I knew I’d take a slight performance hit serving the files over NFS, but I was happy to make that sacrifice to be able to schedule containers on any node in the swarm. It also means I can run the nodes on a separate physical host in my XCP-NG pool and not have to copy several terabytes of VHD.
Apparently, you shouldn’t run databases with NFS as the storage backend. I have a few database containers, so I got wondering just how bad this could be. NFS suffers under high IOPS, and the HDDs that the NFS server is running on suffer under random read/write – which is basically the worst combination for a database. As a quick litmus test, I ran some synthetic benchmarks on a MariaDB container to see what I might be losing.
N.B: This is a poor testing methodology on old crappy hardware. Take these sparse and incomplete results with a fistful of salt. Like I said, this is just a litmus test.
MariaDB Containers:
version: '3.8'
services:
  db-local:
    image: mariadb:10.5.13
    volumes:
      - /home/max/dbtests:/var/lib/mysql
    environment:
      - MYSQL_ROOT_PASSWORD=peepeepoopoo
      - MARIADB_DATABASE=test
    ports:
      - 3310:3306
    deploy:
      placement:
        constraints:
          - "node.labels.number==1"

  db-nfs:
    image: mariadb:10.5.13
    volumes:
      - db-nfs:/var/lib/mysql
    environment:
      - MYSQL_ROOT_PASSWORD=peepeepoopoo
      - MARIADB_DATABASE=test
    ports:
      - 3311:3306
    deploy:
      placement:
        constraints:
          - "node.labels.number==1"

volumes:
    db-nfs:
      driver_opts:
       type: "nfs4"
       o: "addr=10.11.11.108,nolock,soft,rw,nfsvers=4.2"
       device: ":/mnt/xvdb/dbtests"
The local database is using the VHD of the swarm node as storage, and the NFS database is using a generously resourced NFS server on a separate physical machine. The local VHD is running on 4 10K SAS drives in RAID0 (so pretty much a best case scenario), and the NFS server is running on 6 10K SAS drives in RAID6. There is a 10 gigabit link between the NFS server and the swarm node running the containers.
Synthetic Test Method: Sysbench with Percona Lab’s Benchmark
Install:
curl -s https://packagecloud.io/install/repositories/akopytov/sysbench/script.deb.sh | sudo bash
sudo apt -y install sysbench

git clone https://github.com/Percona-Lab/sysbench-tpcc /usr/share/sysbench/percona

cd /usr/share/sysbench/percona
Prepare test:
sysbench /usr/share/sysbench/percona/tpcc.lua --mysql-host=10.11.11.100 --mysql-port=3310 --mysql-user=root --mysql-password='xxxxxx' --mysql-db=test --time=300 --threads=10 --report-interval=1 --tables=1 --scale=20 --db-driver=mysql prepare
Run test:
sysbench /usr/share/sysbench/percona/tpcc.lua --mysql-host=10.11.11.100 --mysql-port=3310 --mysql-user=root --mysql-password='xxxxxx' --mysql-db=test --time=300 --threads=10 --report-interval=1 --tables=1 --scale=20 --db-driver=mysql run
This should run a test with 10 concurrent connection with a database size of around 2GB for 300s. Not too worried about tuning the parameters here, since I’m just looking for the performance delta.
Results:
Local Storage:
SQL statistics:
    queries performed:
        read:                            708780
        write:                           735778
        other:                           108912
        total:                           1553470
    transactions:                        54441  (181.45 per sec.)
    queries:                             1553470 (5177.54 per sec.)
    ignored errors:                      250    (0.83 per sec.)
    reconnects:                          0      (0.00 per sec.)

General statistics:
    total time:                          300.0387s
    total number of events:              54441

Latency (ms):
         min:                                    2.67
         avg:                                   55.11
         max:                                 2669.28
         95th percentile:                      147.61
         sum:                              2999980.83

Threads fairness:
    events (avg/stddev):           5444.1000/65.92
    execution time (avg/stddev):   299.9981/0.01
NFS Storage:
SQL statistics:
    queries performed:
        read:                            450370
        write:                           467478
        other:                           69218
        total:                           987066
    transactions:                        34594  (115.29 per sec.)
    queries:                             987066 (3289.66 per sec.)
    ignored errors:                      155    (0.52 per sec.)
    reconnects:                          0      (0.00 per sec.)

General statistics:
    total time:                          300.0493s
    total number of events:              34594

Latency (ms):
         min:                                    3.51
         avg:                                   86.72
         max:                                 2303.80
         95th percentile:                      262.64
         sum:                              3000095.22

Threads fairness:
    events (avg/stddev):           3459.4000/37.66
    execution time (avg/stddev):   300.0095/0.01
Wow! NFS extracts a pretty heavy toll on overall performance – 35% performance hit across the board, including latency, which is already worryingly high. Hmmm. NFS isn’t looking good, but local isn’t exactly exemplary!! There’s definitely some more digging to be done on this subject. A job for another day though.
How about tuning MariaDB a bit?
Adding –innodb-buffer-pool-size=2048M allows MariaDB to cache up to 2GB in memory for much better performance. Not enough to fit the whole dataset in, but I was running out of memory and it should at least give an indication.
NFS Results:
SQL statistics:
    queries performed:
        read:                            975367
        write:                           1011328
        other:                           151412
        total:                           2138107
    transactions:                        75691  (252.27 per sec.)
    queries:                             2138107 (7126.11 per sec.)
    ignored errors:                      337    (1.12 per sec.)
    reconnects:                          0      (0.00 per sec.)

General statistics:
    total time:                          300.0369s
    total number of events:              75691

Latency (ms):
         min:                                    2.53
         avg:                                   39.63
         max:                                  608.02
         95th percentile:                      132.49
         sum:                              2999799.67

Threads fairness:
    events (avg/stddev):           7569.1000/50.96
    execution time (avg/stddev):   299.9800/0.01
Ok! That’s more like it. Roughly a 50% improvement over performance straight from storage. This would likely improve if you ran a second test since the data would already be in memory. The results also scaled similarly with the local storage database. This makes me not so worried about my NFS storage. I’m not exactly running high traffic websites, so I really don’t need super performance.
Docker Overlay Network Performance Impact
The results above were taken by connecting straight to the docker swarm node that the databases were running on. However, it’s rare that a database container and the web server container will be scheduled on the same node in a swarm, for instance. I’ve casually observed that inter-node routing through the docker overlay network has a BIG performance hit, so I was curious to measure this too. For this test I connected to the second node in the cluster, which re routes the traffic to the first node where the databases are running.
NFS storage with –innodb-buffer-pool-size=2048M:
SQL statistics:
    queries performed:
        read:                            767978
        write:                           796842
        other:                           118478
        total:                           1683298
    transactions:                        59224  (197.36 per sec.)
    queries:                             1683298 (5609.44 per sec.)
    ignored errors:                      272    (0.91 per sec.)
    reconnects:                          0      (0.00 per sec.)

General statistics:
    total time:                          300.0815s
    total number of events:              59224

Latency (ms):
         min:                                    4.02
         avg:                                   50.66
         max:                                  551.36
         95th percentile:                      158.63
         sum:                              3000078.59

Threads fairness:
    events (avg/stddev):           5922.4000/39.31
    execution time (avg/stddev):   300.0079/0.02
All over the shop! Big reduction in queries per second and 10ms increase in average latency. That’s a bit rubbish. My lateral move is clearly not as lateral as I thought – it’s a sizable downgrade! Not only that, but it’s massively inconsistent. As it was running I could see individual values fluctuating all over. Really not very impressive.
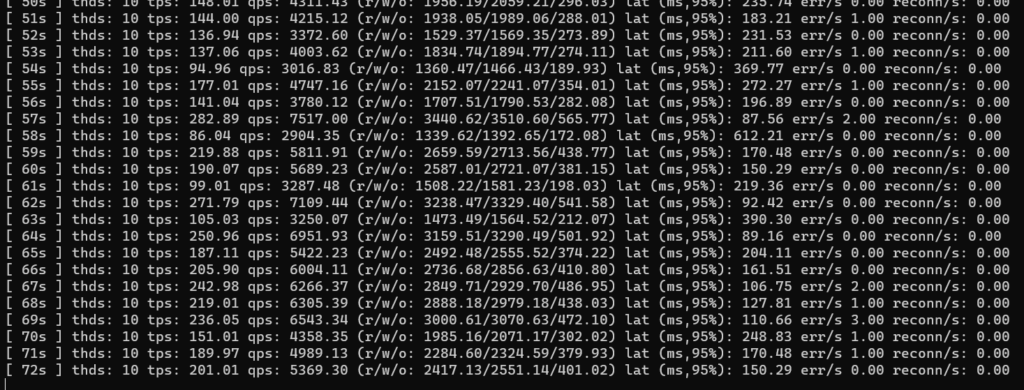
I’ve noticed high utilisation on a single core on a swarm node when it’s routing through the overlay network, so I’m inclined to believe that the docker network stack is single threaded. Since my single core performance is pretty poor, it makes sense that this is the limiting factor. For reference, HTTP transfers on my local network happen at full 1GbE speeds when the traffic is internal to a swarm node, but drops to <40MB/s when the traffic is inter-node.
It seems I’ve opened a can of worms! This definitely requires some further investigation if I want to tune performance on my swarm cluster. I think the easiest option is to move back to a single node Docker – I really don’t need / have any use for the added functionally of swarm and I can’t afford the performance overhead with the hardware I have. Better to keep it lean and mean. Some day I’d like to try this with Kubernetes for comparison, but for now I just want my gigabit speed back!
Leave a Reply